Project Managers, especially those in Professional Services, require timely, accurate and relevant information in order to effectively make decisions. Easy Projects’ Business Intelligence Reports (BI Reports) have the functionality of creating custom, targeted reports that provide integral data.
Easy Projects Business Intelligence is a premium reporting module that’s based on Microsoft’s Power BI application. These reports are versatile and can be used by the project team, C-level executives, clients, and key project stakeholders for greater performance visibility.
The Benefits of Using BI Reports
Quality reports have a tangible impact on how you run your project effectively, whether that concerns finance, productivity, quality or efficiency. Easy Projects’ BI Reports offer:
- Real-time visibility into your project data.
- At-a-glance understanding of important information.
- A complete end-to-end view of your business in one dashboard.
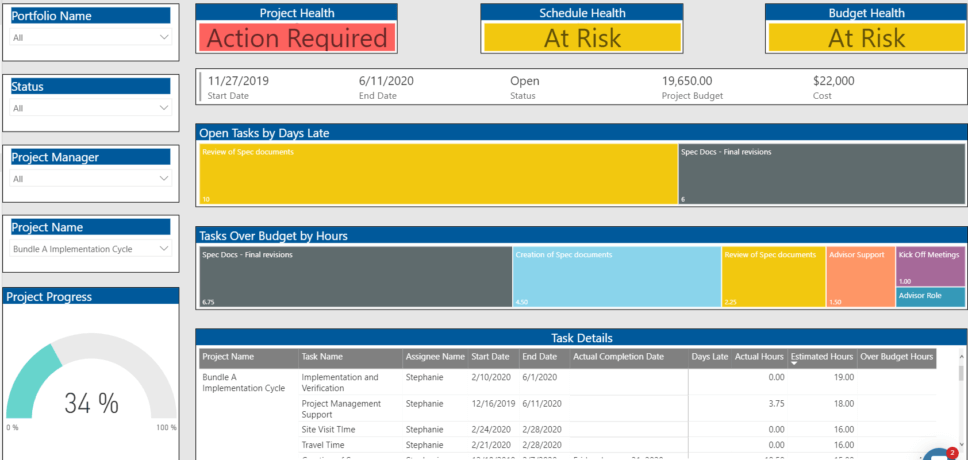
- The ability to drill down into specific items of concern.
- Access to multiple data sources, including those external to Easy Projects (financial systems, CRMs, inventory).
- All of your reports in one convenient location.
Reporting Capabilities
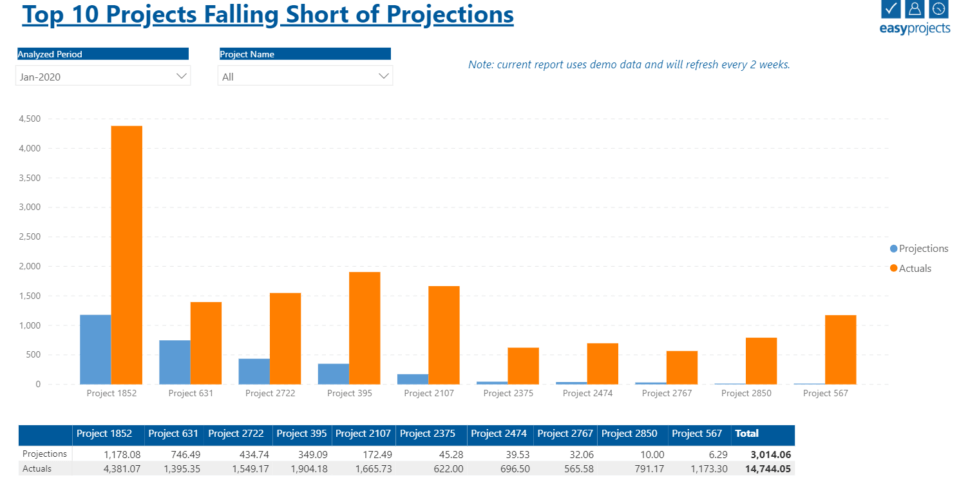
BI Reports offer 60 premium dashboards that have been used by industry professionals. Easy Projects’ reports cover common project reporting needs such as project performance overviews, baseline reporting, and task deadline tracking.
Here are a few examples of reports we’ve built for our customers:
- Quoted vs. Actual Labor Cost: This report compares a project’s financial performance against different criteria, such as which customers earn you the most money.
- Resource Loading by Skill: This variation on the native Resource Loading report allows you to filter and group your users by the built-in Skills field. Now you can easily identify skill-based bottlenecks when planning out project timelines.
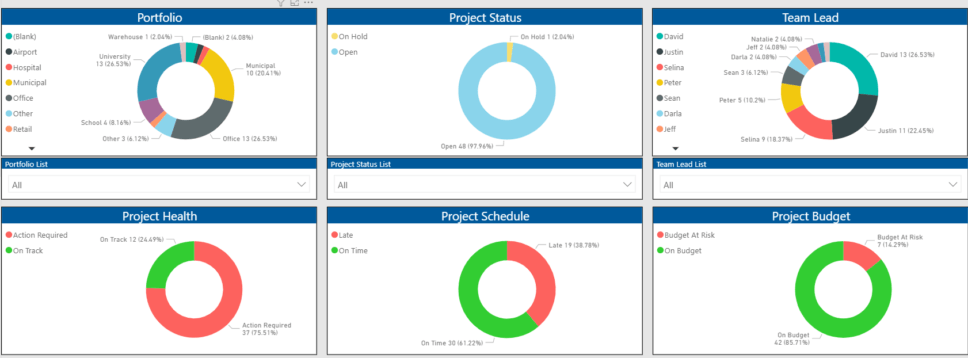
- Project Selection: This report identifies projects that are the best candidates for specific teams or for certain quarters based on workload and potential profit.
- Portfolio Status: This report provides an overview of how many projects are currently active in a portfolio, program or department and the respective statuses of each. This report can be filtered down further by the Project Manager in charge, end date, service type, and more.
- Timesheet Trends by Team: This report offers you insight into underperforming teams by providing historical trends of timesheet logs by team assignment.
Please note that this feature is currently only offered for Professional Services. Have an idea for your own report? Contact our Customer Success Experts to learn how Power BI can improve your productivity!
